HTML to PDF in Node.js with tables, page breaks and page numbers
Render a multi-page report from HTML and JSON in Node.js with Dynamic Document API. Long tables that repeat their header, sections that start on a new page, and a running header and footer with page numbers, in about 60 lines of code and no dependencies.
This tutorial renders a nine-page sales report from an HTML template and a JSON file in Node.js. It covers the three things that make or break a multi-page PDF:
- Long tables that break across pages without splitting a row, and repeat their header row on every page.
- Page breaks where you want them: each section on a new page, headings kept with the content that follows.
- A running header and footer with the company name and "Page 3 of 9".
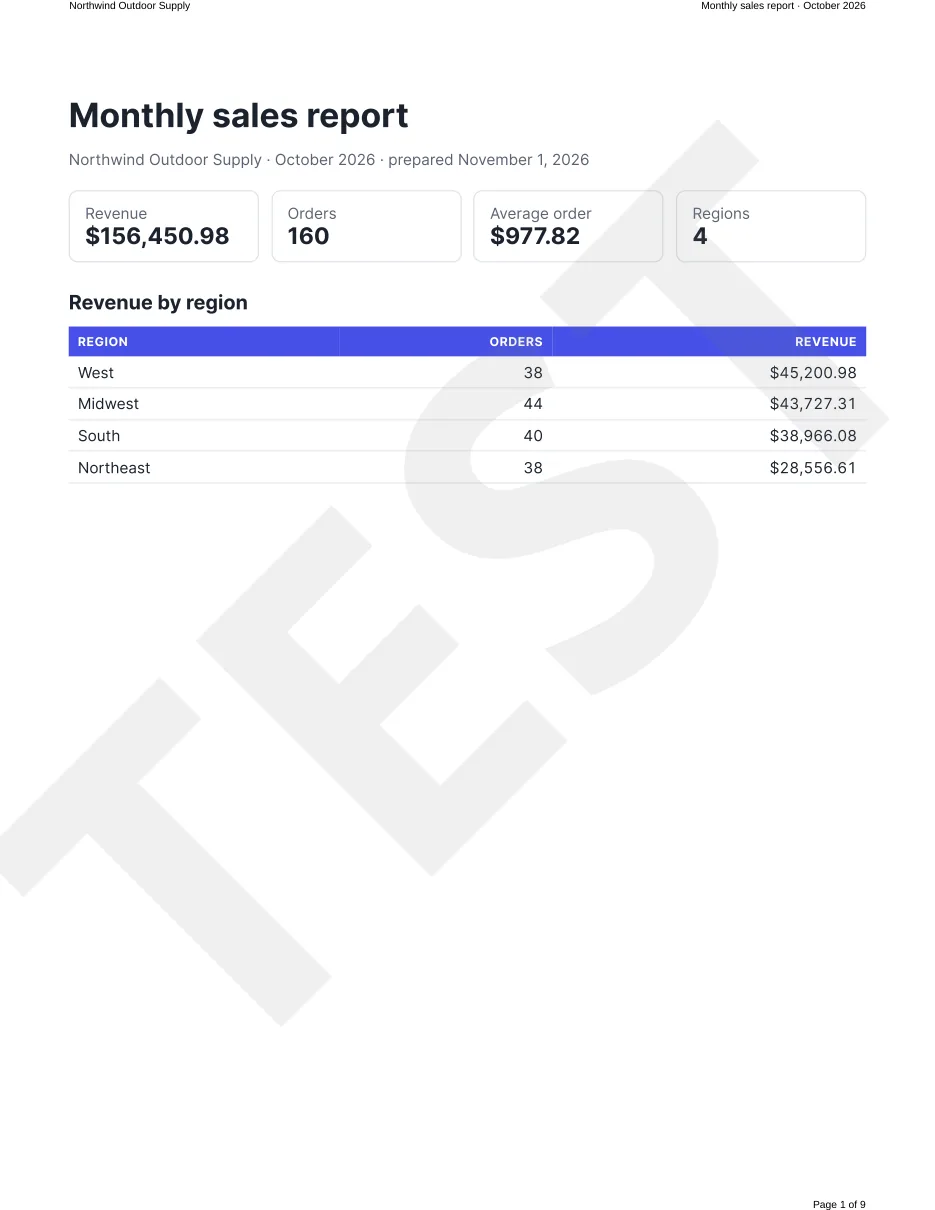
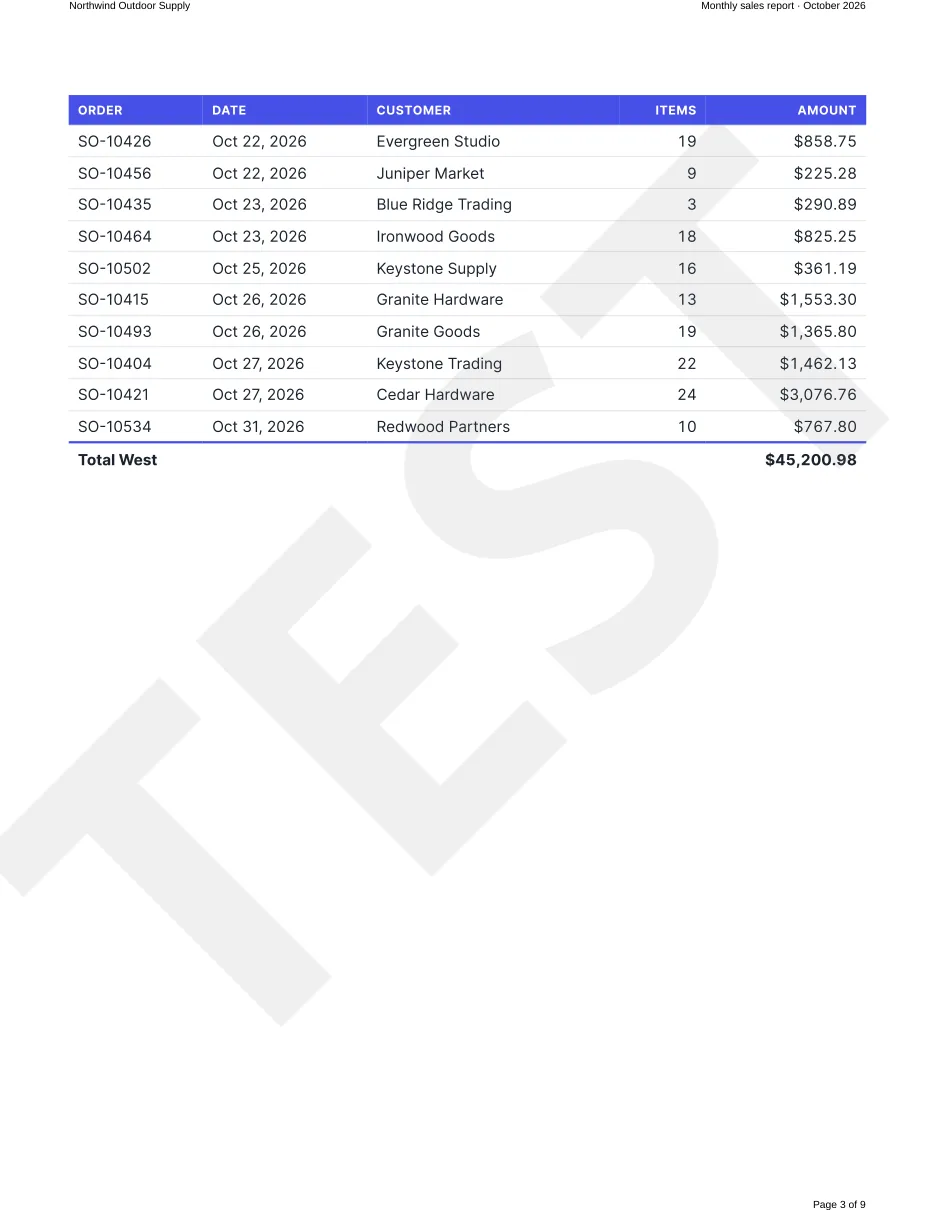
You need Node.js 18 or newer (for the built-in fetch) and an API key from the dashboard at https://app.dynamicdocumentapi.com. A test key (dda_test_…) is free and adds a TEST watermark. No npm packages are needed. The complete example is on GitHub: report.html, orders.json with 160 sample orders, and report.mjs.
How it works
Your code doesn't build the HTML. It sends the template and the data in one request, and Dynamic Document API fills the template with the template language, renders it in Chromium and returns the PDF:
report.mjsreadsorders.json, groups the orders by region and adds the totals.- It sends
report.htmlashtml, the grouped data asdata, and the page settings aspdftoPOST /v1/pdf/from-html. - The response is the PDF itself, written to
report.pdf.
Keeping data and layout apart means no string concatenation in JavaScript and no escaping bugs: values are escaped when they're inserted into the HTML.
1. The template
report.html is ordinary HTML and CSS with placeholders. Loops ({% for %}) produce the table rows, and filters format money and dates for a locale.
<!DOCTYPE html>
<html lang="en">
<head>
<meta charset="utf-8">
<title>{{ report.title }}</title>
<style>
  body { font-family: Inter, "Liberation Sans", Arial, sans-serif; font-size: 10pt; color: #1d2330; margin: 0; }
  h1 { font-size: 22pt; margin: 0 0 4pt; }
  h2 { font-size: 13pt; margin: 18pt 0 8pt; }
  .muted { color: #5d6475; }

  /* Key figures: a grid that never splits across pages. */
  .kpis { display: grid; grid-template-columns: repeat(4, 1fr); gap: 8pt; margin: 14pt 0; break-inside: avoid; }
  .kpi { border: 1px solid #dfe2ea; border-radius: 6pt; padding: 8pt 10pt; }
  .kpi b { display: block; font-size: 15pt; }

  /* Long table: the header row repeats on every page, rows never split. */
  table { width: 100%; border-collapse: collapse; }
  thead { display: table-header-group; }
  th { text-align: left; font-size: 8pt; text-transform: uppercase; letter-spacing: .05em; color: #fff; background: #4751e9; padding: 5pt 6pt; }
  td { padding: 4pt 6pt; border-bottom: 1px solid #e6e8ef; }
  tr { break-inside: avoid; }
  .num { text-align: right; font-variant-numeric: tabular-nums; white-space: nowrap; }
  tfoot td { font-weight: 700; border-top: 2px solid #4751e9; border-bottom: none; }

  /* Each region starts on a new page; keep a heading with the content that follows it. */
  .region { break-before: page; }
  h2 { break-after: avoid; }
</style>
</head>
<body>
  <h1>{{ report.title }}</h1>
  <p class="muted">{{ company.name }} · {{ report.period }} · prepared {{ report.prepared | format_date("long", "en-US") }}</p>

  <div class="kpis">
    <div class="kpi"><span class="muted">Revenue</span><b>{{ totals.revenue | format_currency("USD", "en-US") }}</b></div>
    <div class="kpi"><span class="muted">Orders</span><b>{{ totals.orders }}</b></div>
    <div class="kpi"><span class="muted">Average order</span><b>{{ totals.average | format_currency("USD", "en-US") }}</b></div>
    <div class="kpi"><span class="muted">Regions</span><b>{{ regions | length }}</b></div>
  </div>

  <h2>Revenue by region</h2>
  <table>
    <thead><tr><th>Region</th><th class="num">Orders</th><th class="num">Revenue</th></tr></thead>
    <tbody>
      {% for region in regions %}
      <tr><td>{{ region.name }}</td><td class="num">{{ region.orders | length }}</td><td class="num">{{ region.revenue | format_currency("USD", "en-US") }}</td></tr>
      {% endfor %}
    </tbody>
  </table>

  {% for region in regions %}
  <section class="region">
    <h2>{{ region.name }}: all orders</h2>
    <table>
      <thead><tr><th>Order</th><th>Date</th><th>Customer</th><th class="num">Items</th><th class="num">Amount</th></tr></thead>
      <tbody>
        {% for order in region.orders %}
        <tr>
          <td>{{ order.id }}</td>
          <td>{{ order.date | format_date("medium", "en-US") }}</td>
          <td>{{ order.customer }}</td>
          <td class="num">{{ order.items }}</td>
          <td class="num">{{ order.amount | format_currency("USD", "en-US") }}</td>
        </tr>
        {% endfor %}
      </tbody>
      <tfoot><tr><td colspan="4">Total {{ region.name }}</td><td class="num">{{ region.revenue | format_currency("USD", "en-US") }}</td></tr></tfoot>
    </table>
  </section>
  {% endfor %}
</body>
</html>
The CSS rules that control the pages:
| Rule | Effect |
|---|---|
thead { display: table-header-group; } | The header row repeats at the top of every page the table runs onto |
tr { break-inside: avoid; } | A row is never cut in half at a page break |
.region { break-before: page; } | Every region starts on a new page |
h2 { break-after: avoid; } | A heading never ends up alone at the bottom of a page |
.kpis { break-inside: avoid; } | The key figures stay together |
More rules and fixes for typical problems, such as an empty last page: pagination basics.
2. The script
report.mjs prepares the data and sends the request. The page settings go in the pdf object: US Letter, margins, and a header and footer in simple mode, where {{page}} and {{pages}} become the page numbers.
// Renders a multi-page sales report from orders.json with Dynamic Document API.
// Node.js 18 or newer (built-in fetch), no dependencies:
//   DYNAMIC_DOCUMENT_API_KEY=... node report.mjs
import { readFile, writeFile } from "node:fs/promises";

const orders = JSON.parse(await readFile(new URL("./orders.json", import.meta.url), "utf8"));
const html = await readFile(new URL("./report.html", import.meta.url), "utf8");

// Group the orders by region and add the totals the report shows.
const byRegion = new Map();
for (const order of orders) {
  if (!byRegion.has(order.region)) byRegion.set(order.region, []);
  byRegion.get(order.region).push(order);
}
const regions = [...byRegion]
  .map(([name, list]) => ({ name, orders: list, revenue: list.reduce((sum, o) => sum + o.amount, 0) }))
  .sort((a, b) => b.revenue - a.revenue);
const revenue = regions.reduce((sum, r) => sum + r.revenue, 0);

const data = {
  company: { name: "Northwind Outdoor Supply" },
  report: { title: "Monthly sales report", period: "October 2026", prepared: "2026-11-01" },
  totals: { revenue, orders: orders.length, average: revenue / orders.length },
  regions,
};

const response = await fetch("https://api.dynamicdocumentapi.com/v1/pdf/from-html", {
  method: "POST",
  headers: {
    Authorization: `Bearer ${process.env.DYNAMIC_DOCUMENT_API_KEY}`,
    "Content-Type": "application/json",
  },
  body: JSON.stringify({
    html,
    data,
    pdf: {
      paper: { size: "Letter" },
      margin: { top: "22mm", right: "16mm", bottom: "20mm", left: "16mm" },
      header: {
        enabled: true,
        left: "{{ company.name }}",
        right: "{{ report.title }} · {{ report.period }}",
        height: "14mm",
      },
      footer: { enabled: true, right: "Page {{page}} of {{pages}}", height: "12mm" },
      metadata: { title: "Monthly sales report, October 2026" },
    },
    delivery: "binary",
  }),
});

if (!response.ok) {
  throw new Error(`Render failed: ${response.status} ${await response.text()}`);
}
await writeFile("report.pdf", Buffer.from(await response.arrayBuffer()));
console.log("Wrote report.pdf");
The header and footer can use your data too: {{ company.name }} is filled from the same data as the page. For a logo or your own layout, use HTML mode instead of left, center and right, see headers and footers.
3. Run it
export DYNAMIC_DOCUMENT_API_KEY="dda_test_..."
node report.mjs
report.pdf has nine pages: the overview, and two pages for each of the four regions, with the table header repeated on the second page of each region and the page numbers in the footer.
Next steps
- Get a link instead of the file. Leave out
deliveryand the response is JSON with a signed download URL, valid for one hour by default. See renders. - Store the template. Save
report.htmlas a template in the dashboard and send only its ID and the data toPOST /v1/pdf/from-template. Templates are versioned, so a design change never breaks a running integration. - Render in the background. For large documents or many at once, send the request asynchronously and get a webhook when the PDF is ready, or use batches.
- Make retries safe. In production, send an
Idempotency-Keyheader with every request and reuse it when you retry, so a retried request returns the first result instead of rendering twice. See the quickstart. - Charts. Draw them with any JavaScript chart library in the page and tell the renderer to wait for them with the wait options.
Related: quickstart, PDF options, pagination basics, headers and footers, template language.
Invoice PDFs from Google Sheets with n8n
Turn rows in a Google Sheet into branded PDF invoices, email each one with Gmail and mark the rows as sent, with the verified %%BRAND%% node for n8n. Workflow and sample sheet included.
Renders
Create PDFs and images with POST /v1/renders, from the request body and sync or async modes to delivery, idempotency, listing and rate limits.